Configure and utilize Network Visualization
The network visualization page in Prism makes use of SNMP and LLDP to find info about the connected top of rack switch. SNMP is used to get switch information like the name, ports, and port statistics. LLDP is used by the AHV hosts to find out which Nutanix node is plugged into which switch port.
Using the network visualization screen – you can do all sorts of troubleshooting. Problems that have a single network link, switch, or host in common can be found out through the visualizer. You can drill into the individual port statistics on errors and match those to host side errors as well. This can be useful information to send over to a networking team.
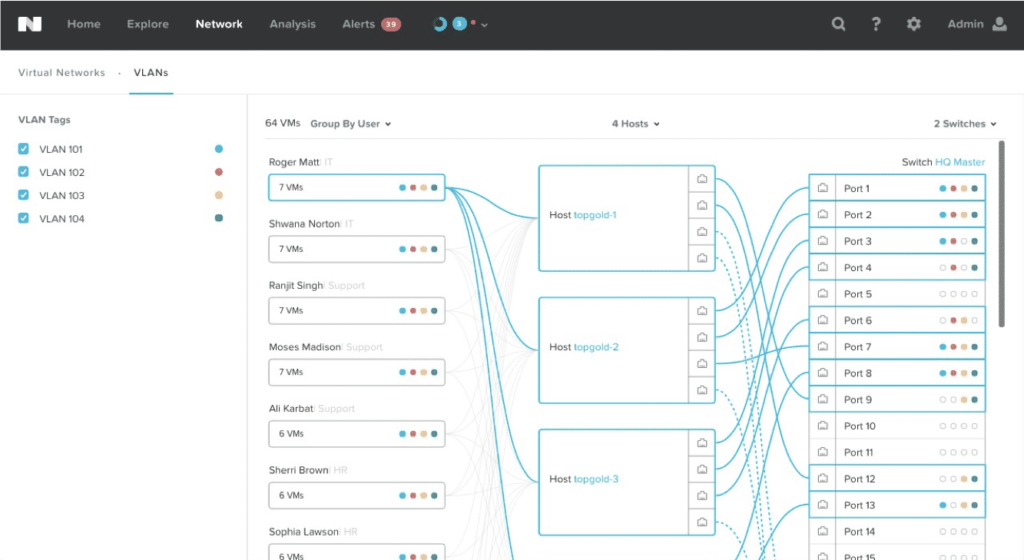
The network visualizer includes the virtual networks pane and the topology view.
- Virtual Networks Pane
- Lists the virtual networks (VLANs) configured on the Nutanix cluster. Selecting a VLAN includes the VMs on that VLAN in the topology view. Conversely, clearing a check box excludes the VMs on that VLAN from the topology view. You can show up to five VLANs at a time.
- The check box titled Other corresponds to VMs that are not on any VLAN. At a minimum, this check box is associated with the Controller VMs in the cluster.
- Topology View
- VLANs configured on the cluster. The visualizer displays a different color for each VLAN. It shows the VLANs to which a VM or the VMs in a VM group belong. It also shows which VLANs are configured on a first-hop switch.
- VMs
- VMs on the VLANs that are selected in the virtual networks pane. Filter and group-by options enable you to customize the topology view.
- Hosts
- Hosts in the Nutanix cluster. The filter above the hosts enables you to specify which hosts you want to show in the topology view.
- Switches
- First-hop switches and the VLANs configured on each of them. The filter above the switches enables you to specify which switches you want to show in the topology view.
Viewing VM Information
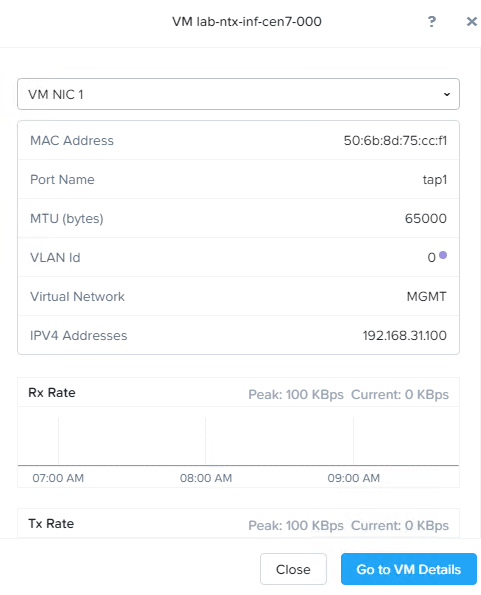
In the visualizer, you can view the settings and real-time statistics of a virtual NIC.
To view VM information, do the following:
- Use the group-by and filtering capabilities of the visualizer to show the VM you want, and then click the name of the VM.
- The VM network information window appears.
- From the virtual NIC list at the top of the dialog box, select the NIC for which you want show settings and statistics.
- For information about the statistics that are displayed for the virtual NICs, see VM NICs Tab.
- Optionally, point to a location on a graph to view the value at that point in time.
- If you want additional information about the VM, click Go to VM Details.
- The VM table view on the VM page is displayed.
Viewing Host Information
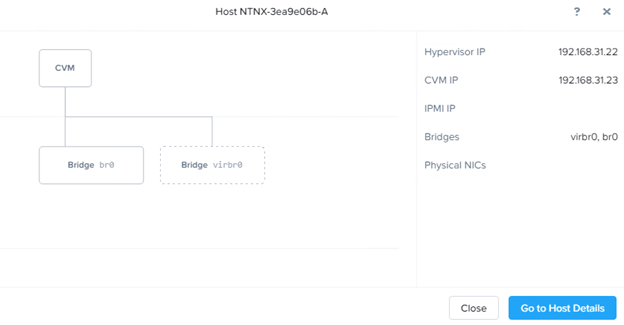
In the visualizer, you can view the internal network diagram of a Nutanix host. You can click a network component, such as a bridge or bond, to view the settings and statistics of that component.
To view host information, do the following:
- In the topology view, click the name of a host.
- The host network information window appears. The window shows a diagram of the host’s internal network. The right pane displays host network information.
- Click any network component in the diagram and view its network settings and statistics in the right pane.
- Click the Controller VM, and then, in the right pane, select a virtual NIC from the list to view settings and statistics of that virtual interface. Optionally, point to a location on a graph to view the value at that point in time.
- For information about the statistics that are displayed for the virtual NICs, see VM NICs Tab.
- Click a bridge to view the settings of the bridge.
- A solid rectangle indicates an external bridge. A dotted rectangle indicates an internal bridge.
- Click a bond to view the settings of the bond.
- Click a host interface to view the settings of the interface. For a host interface, statistics are shown in addition to interface settings. Point to a location on a graph to view the value at that point in time. For information about the statistics that are displayed for the host NICs, see Host NICs Tab.
- A solid line leading from a bond to a host interface indicates an active connection. A dotted line indicates a backup connection.
- If you want additional information about the host, click Go to VM Details.
- The Host table view on the Hardware page is displayed.
Viewing Switch-Level Information
Switch-level information includes details such as switch name, vendor, and management IP address.
To view switch-level information, do the following:
- In the topology view, click the name of a switch.
- The switch information window is displayed.
- To view additional switch information, click Go to Switch Details.
- The Switch view on the Hardware page is displayed.
Viewing Interface-Level Information
Interface-level information includes details such as interface name, physical address, and interface type. The visualizer also displays statistics for each interface.
To view interface-level information, do the following:
- Click a switch interface.
- The switch port information window is displayed. The window shows both network settings and interface statistics.
- For information about the statistics that are displayed for switch interfaces, see Switch Tab.
- Optionally, to show the value at any given point in time in a graph, point to the location on the graph.