Identify dashboards and monitoring tools that can be used to resolve cluster issues
Advanced Pages
CVMIP/DNS:Port
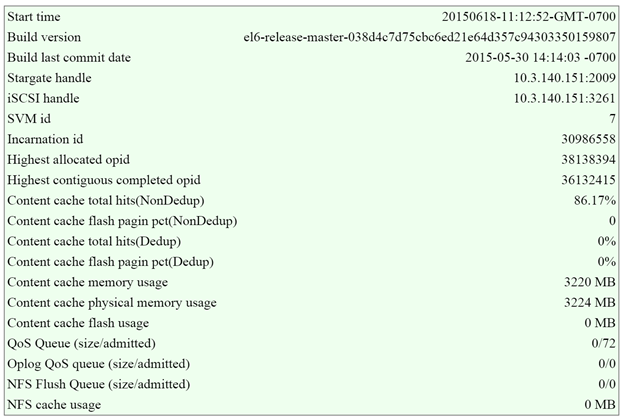
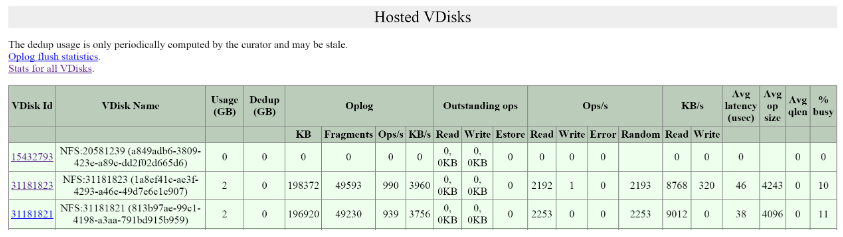
- 2009: Stargate page to monitor backend storage
- Check QoS Queue and OpLog QoS queue (admitted/outstanding IO’s)
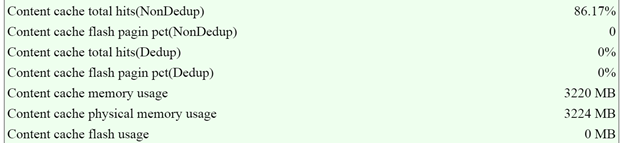
- Cache hit rates should be 80-90%+ if workload is ready heavy for best possible performance
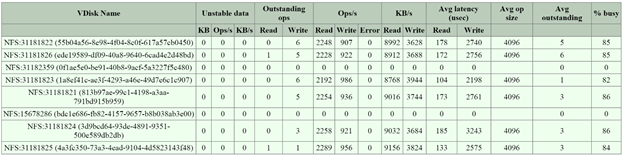
- Check Avg Latency, Avg Op Size, Avg. Outstanding

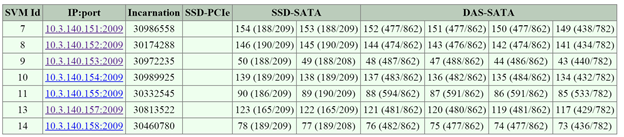
- 2009/latency: Stargate page backend latency
- 2009/vdisk_stats: Stargate page histograms of I/O, latency, writes
- If high read latency, check read source for vDisk and look where I/Os are served from (more than likely reads coming from HDD)
- Random/smaller IO (<64K) written directly to OpLog. Larger/sequential IO bypass
- OpLog and written to extent store (Estore)
- Ops and Randomness section shows if IO is random or sequential
- Working Set Size shows last 2 minutes and 1 hour
- Read source shows where IO’s are being served from
- Write Destination shows where IO’s are going
- Extent Group Up-Migration shows data up-migrated in last 300, 3600, and 86400 seconds
- 2009/h/traces: Stargate page monitor activity traces for operations
- 2009/h/vars: Stargate page monitor varous counters
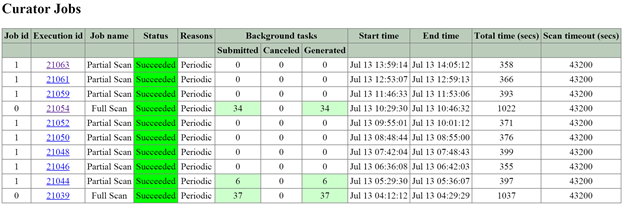
- 2010: Curator page for Curator runs
- Need to be on the Curator master
- Partial scan every 60 minutes
- Full scan every 6 hours
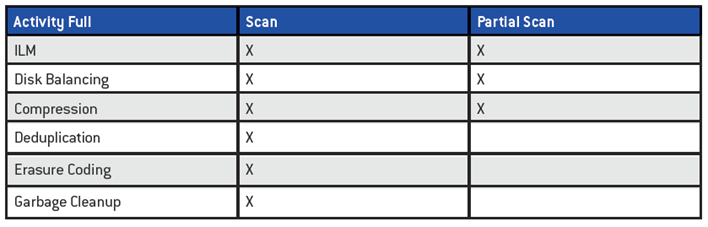
- Also triggered by:
- Periodic (normal state)
- Disk/Node/Block failure
- ILM Imbalance
- Disk/Tier Imbalance
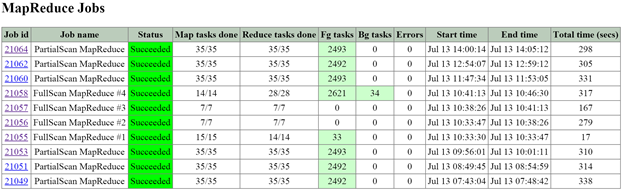
- Partial scans have a single MapReduce job
- Full scans have four
- 2010/master/control: Curator page for manually starting jobs
- 2011: Chronos page monitors jobs/tasks scheduled by Curator
- 2020: Cerebro page monitors PDs/rep status/DR
- 2020/h/traces: Cerebro page to monitor activity traces for PD/rep
- 2030: Main Acropolis page for details about hosts/tasks/networking
- 2030/sched: Acropolis page with info about VM/resource scheduling/placement decisions
- 2030/tasks: Acropolis page shows info about Acropolis tasks/state
- 2030/vms: Information about Acropolis VMs
Cluster Commands
Cluster Status:
cluster status
Local CVM Status:
genesis status
Check Upgrade Status:
upgrade_status
Stop Cluster Service:
cluster stop [Service Name]
Start Stopped Cluster Services:
cluster start #NOTE: This will start all stopped services
Start Single Service:
cluster state [Service Name]
Restart Local Service:
genesis stop [Service Name]
Find Cluster ID:
zeus_config_printer | grep cluster_id
Find AOS Version:
allssh “cat /etc/nutanix/release_version”
Find CVM Version:
allssh “cat /etc/nutanix/svm-version”
Run NCC Health Checks:
ncc health_checks run_all
Logs
All cluster logs:
allssh “cat ~/data/logs/Acropolis.log”
Errors logs:
allssh “cat ~/data/logs/[COMPONENT].ERROR”
Fatal logs:
allssh “cat ~/data/logs/[COMPONENT].FATAL”
Storage Layers and Monitoring
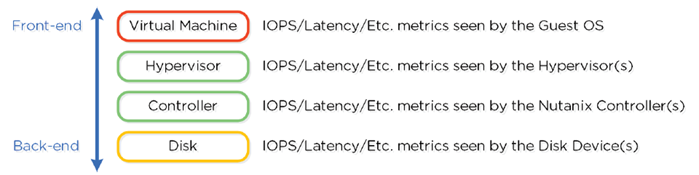
VM Layer
- Metrics reported by hypervisor for VM
- Represent performance VM is seeing
- Indicative of I/O
- Usage: troubleshooting VM level
Hypervisor Layer
- Metrics reported by hypervisor
- Represent performance Hypervisor is seeing
- Usage: detailed/valuable metrics
Controller Layer
- Metrics from Nutanix Controllers
- From CVM’s
- What front-end is seeing from NFS/SMB/iSCSI or backend operations (balancing, ILM).
- Should normally match hypervisor layer
- Usage: show backend operations
Disk Layer
- Metrics reported by disk devices
- Pulled from physical disks.
- Data hitting OpLog or Extent Store.
- Usage: See how many ops served from cache or disk