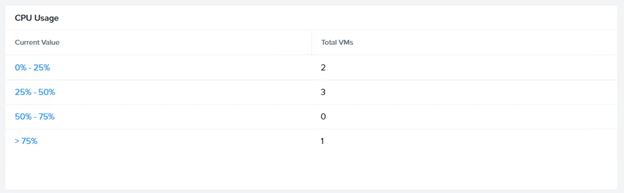
Monitor CPU/Memory utilization to identify problems and propose solutions
Metric Chart
Create a chart with an analysis focus on metrics like IOPs, Latency, or Bandwidth. Can have more than one (1) selected Entity.
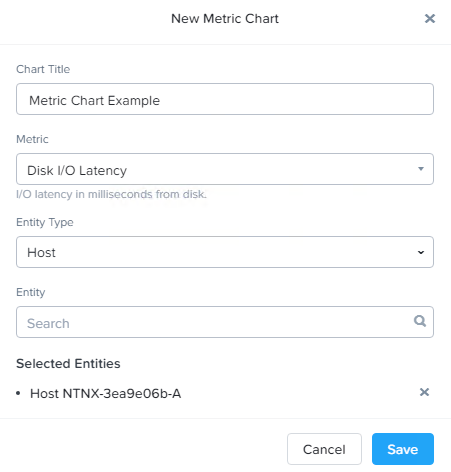
Analysis of multiple Entities against a single Metric.
Entity Chart
Create a chart with a focus on an entity like a Host or a Virtual Machine. Can have more than one (1) selected metric.
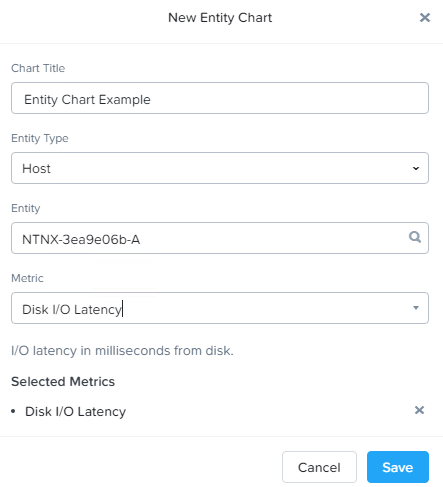
Analysis of multiple Metrics against as single Entity.
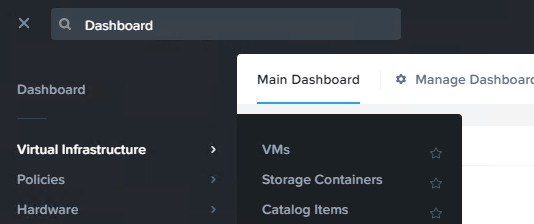
Use Prism Central to Monitor and Identify Problems
Virtual Infrastructure > VM’s > Metrics
Utilization
If the issue revolves around utilization, it may be related to monitoring and not directly associated to any performance complaint.
- What made the customer look at utilization?
- Do the times of increased utilization cause an alert event?
- Do the times of increased utilization correlate to a degradation in throughput or response time?

Throughput
Throughput issues require a more detailed definition of the problem and the related workload.
- How is the throughput being measured (Job/time, Op/s, b/s, B/s, KB/s)?
- Are the IO operations (IOPs) small or large?
- Are the IOPs random or sequential?
- Is the issue with Read Ops, Writes or both?
- Define the workload – Is it multi or single-threaded?
- Are relevant Nutanix Best Practice documents being followed?
Response Time
Is the issue related to sustained response time or outliers (spikes in latency)?
- If the issue is with sustained response time, is there a correlation with throughput?
- Where is the response time being measured?
- Is the issue with reads, writes or both?
- If the issue is with spikes, how long do the increases in response time last?
- What is the expected response time?
Layers of Metrics
- Think about storage IO as it’s passed from guest to hypervisor to CVM to disk.
- VM/vDisk
- Measured between the VM/vDisk and hypervisor storage adapter.
- Leverage in-guest tools such as Perfmon (windows), top, iostat, and so on.
- Container
- Aggregate of all IO for the datastore / container.
- Desktop, vCenter graphs, Prism.
- Host
- Both hypervisor and physical media metrics.
- Unified Cache metrics.
- Disk
- Hardware metrics
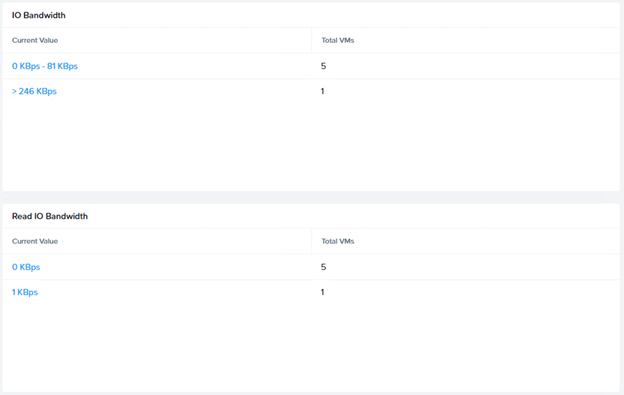
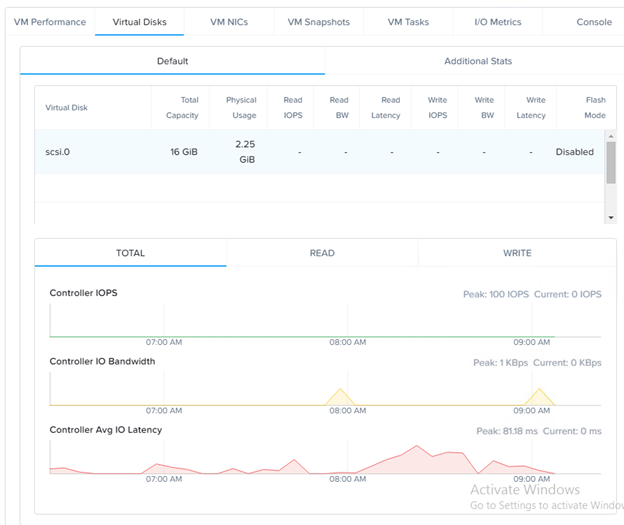
VM Metrics
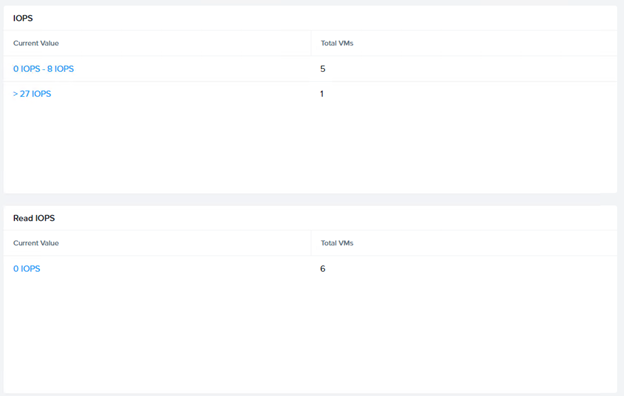
- Controller read/write IOPs
- Controller Bandwidth
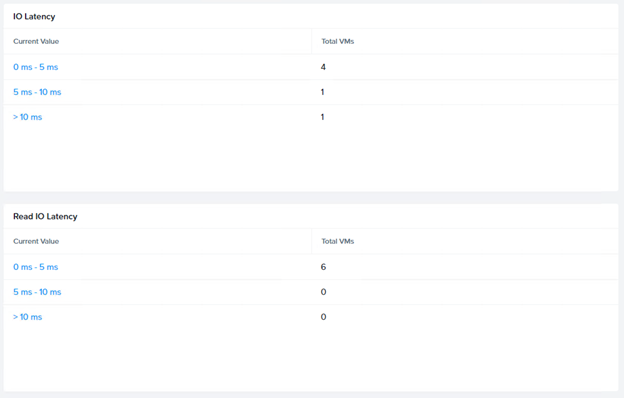
- Controller Latency
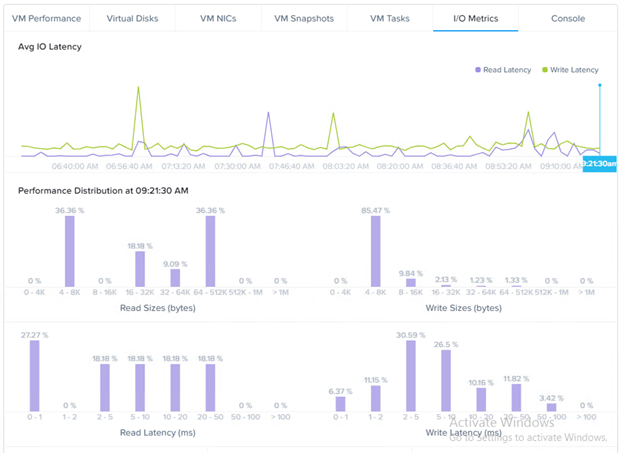
VM/vDisk Latency Details
- Read/Write statistics for individual vDisks can be seen under IO-Metrics
- Average IO Latency
- IO Latency Histogram
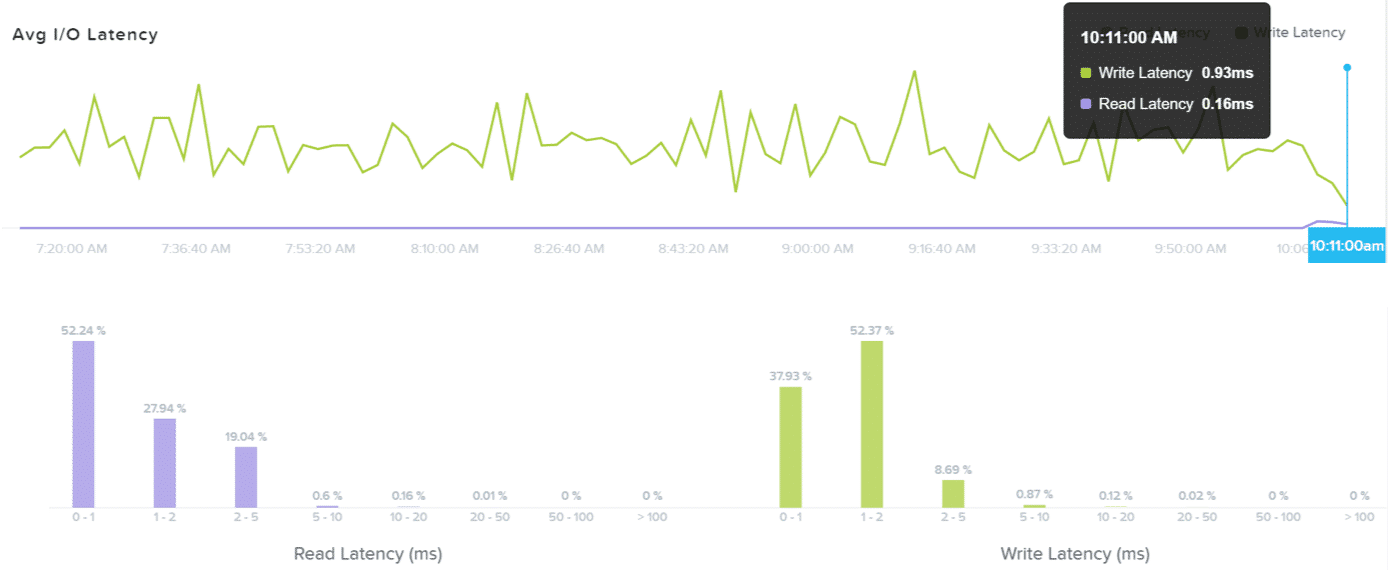
Note on the Usefulness of Histograms
- Histograms are particularly useful for determining outliers
- A few highly-latent OPs can have a significant impact on the Average Latency for a vDisk, VM, container, and so on
- Reminder – Avoid focusing on a single statistic as the indicator of a problem
- Analyze the full environment
VM/vDisk IO Characterization
- When characterizing problem IO:
- IOP Size – is the VM sending many small OPs or a few large OPs?
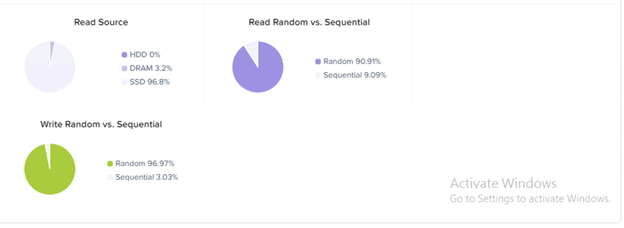
Read Source
- High % DRAM or SSD indicates that the VM’s working set is fitting within the hot tier
- High % HDD indicates that SSDs may be low on capacity or that the VM is scanning old data
Random vs. Sequential
- Writes – Is the IO going through the Oplog or straight to Extent Store?
- Reads – Random OPs potentially generate more metadata lookup overhead
- Do not run diagnostics.py because it is intrusive and destructive. It is only to be ran after foundation
Host Metrics
- CPU and Memory Usage
- Disk Statistics
- As reported by the CVM on that host
Collecting Performance Data
- Full instructions for collect_perf can be found by running collect_perf –helpshort on a CVM
- Contact support before running collect_perf
- If possible, collect data before/during/after the event
- If issue is ongoing, collect 2-4 hours of data
$ collect_perf start
$ collect_perf stop