Utilize the Health dashboard and its major components
The Health dashboard displays dynamically updated health information about VMs, hosts, and disks in the cluster. To view the Health dashboard, select Health from the pull-down list on the left of the main menu.

Screen Details
The Health dashboard is divided into three columns:
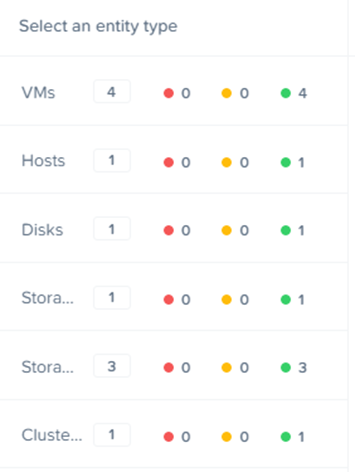
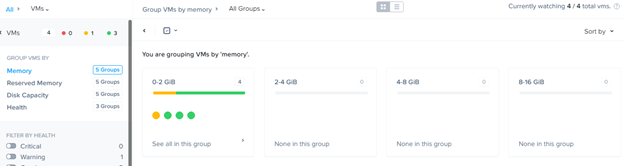
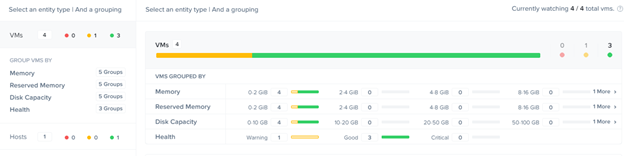
- The left column displays tabs for each entity type (VMs, hosts, disks, storage pools, containers, cluster services, and [when configured] protection domains and remote sites). Each tab displays the entity total for the cluster (such as the total number of disks) and the number in each health state. Clicking a tab expands the displayed information (see following section).
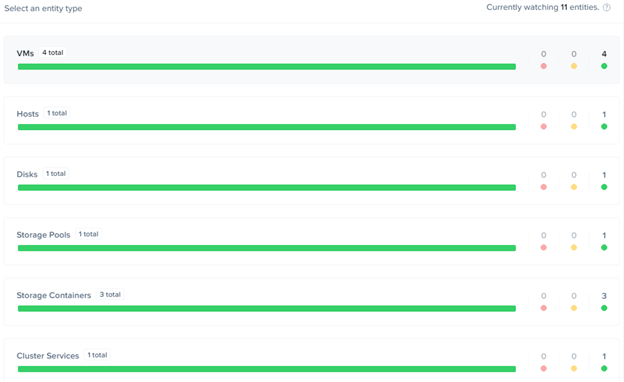
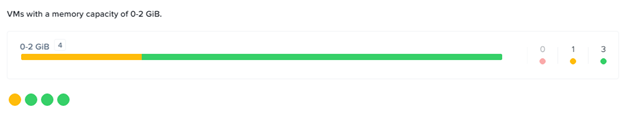
- The middle column displays more detailed information about whatever is selected in the left column.
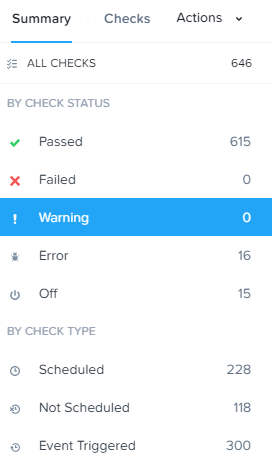
- The right column displays a list of the available health checks along with the current status of each check (success, warning, failure, or disabled).
- Hovering the cursor over an entry displays more information about that health check.
- You can filter the list by selecting one of the buttons at the top of the column.
- You can learn more about (or reconfigure) the health checks by clicking one of the health checks in the list or the Manage Checks button.