Use Prism Central to identify and fix bottlenecks and anomalies
Anomaly Detection
Behavioral analysis functions have been added to existing predictive functions to provide anomaly based alerts and alarms. These are dynamic and change based on ongoing analysis of the environment. Think thresholds but dynamic thresholds based on machine learning and historical analysis. Anomaly detection is valuable as it indicates when KPIs (e.g. CPU utilization) have a significant deviation from the norm.
The system predicts a normal behavior band for various metrics based on historical data. The anomaly detection module monitors a predefined set of metrics on a daily basis and publishes baseline values for each of the metrics.
- Twenty-seven metrics are monitored for VMs, hosts, and clusters.
- Data for each metric from the past 21 days is recorded and analyzed, a normal behavior band is established, and predictions for the next 7 days are formulated.
- The behavior bands and predictions are adjusted accordingly when time period or trend patterns are observed, for example low CPU on weekends or increasing CPU usage.
The anomaly detection module measures usage every five minutes and compares that usage with the predicted values. If the observed value is outside the band, it flags that value as an anomaly. Each anomaly is recorded as an event. Anomalies appears as outliers in the behavioral anomaly event details screen and the VM details Metrics tab.

Bottleneck Detection
Bottleneck detection identifies VMs that could be bottlenecked due to resource constraints. It utilizes machine learning and behavioral analysis.
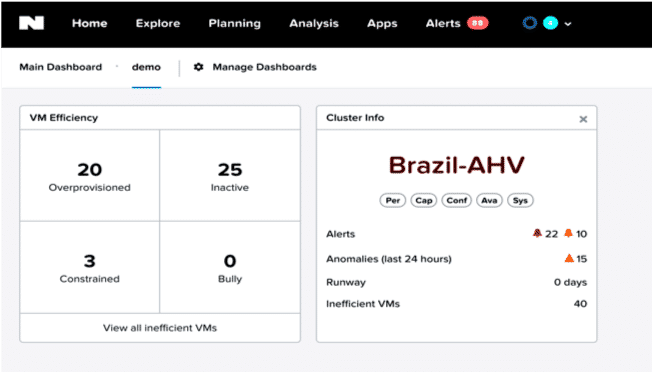
VM Right Sizing: Dashboard
- It is useful to look at the profile of your VMs
when analyzing problems in a cluster or assessing future resource needs.
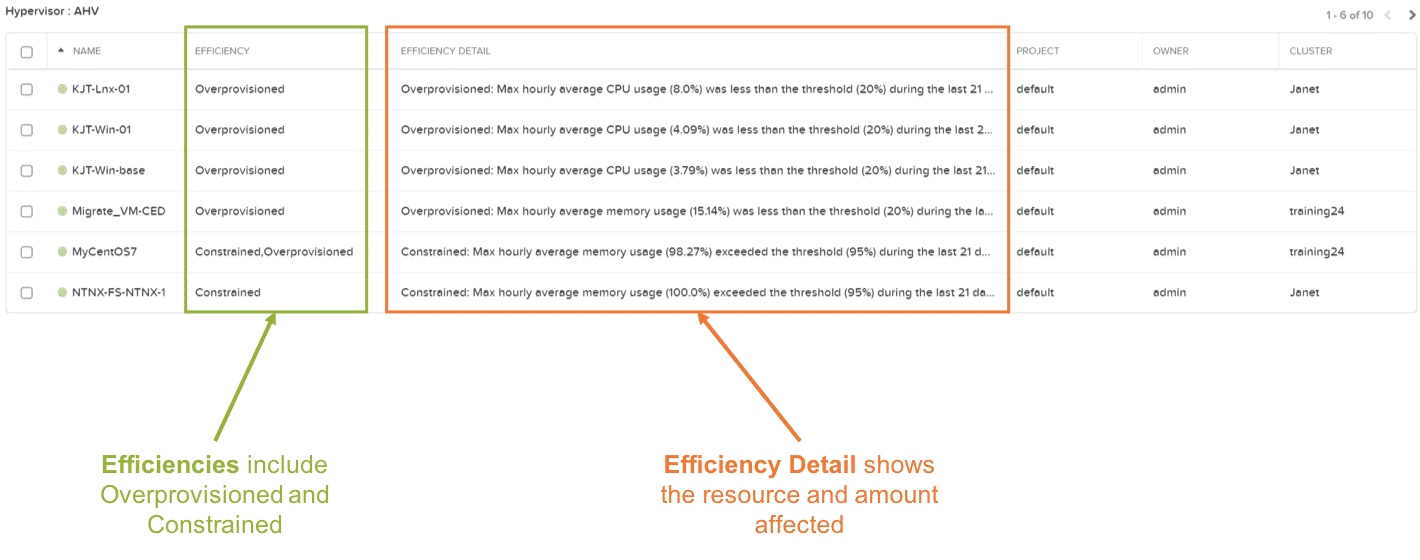
- This can help you identify VMs that are not optimally configured such as ones that consume too many resources, are constrained, are over provisioned, or are inactive.
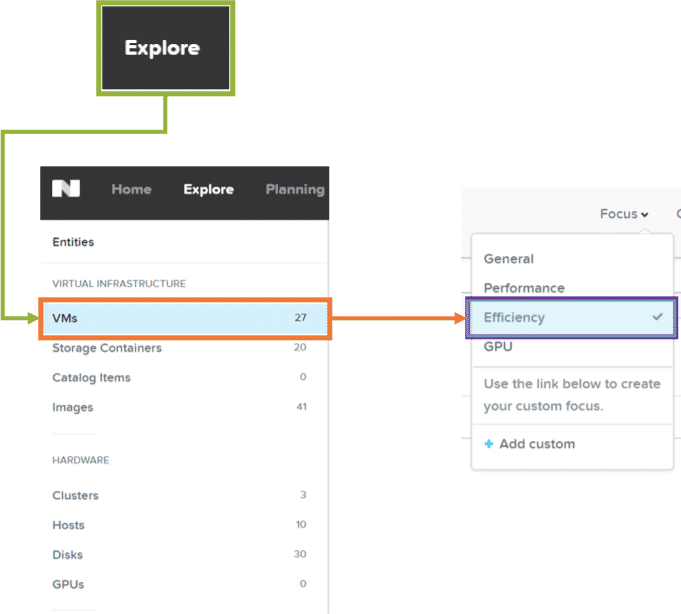
- The right-sizing feature identifies inefficient
VMs that fit one of the 4 profiles shown here under
- VM Efficiency:
- Bully
- Constrained
- Over-provisioned
- Inactive
- VM Efficiency:
VM Right Sizing: Bully VM
- A Bully VM is a set of VMs that consume the majority of resources and cause other VMs to starve for capacity.
- Identifying Bully VMs can help you to determine the root cause of performance degradation.
- The algorithm that helps you to find Bully VMs
works like this:
- Detect contention every hour based on the
following parameters:
- Any VM CPU Ready Time > 5%
- Any VM Memory Swap Rate > 0 Kbps
- Host I/O Stargate CPU Usage > 85%
- This algorithm helps by flagging VMs that overuse CPU, Memory or I/O.
- Detect contention every hour based on the
following parameters:
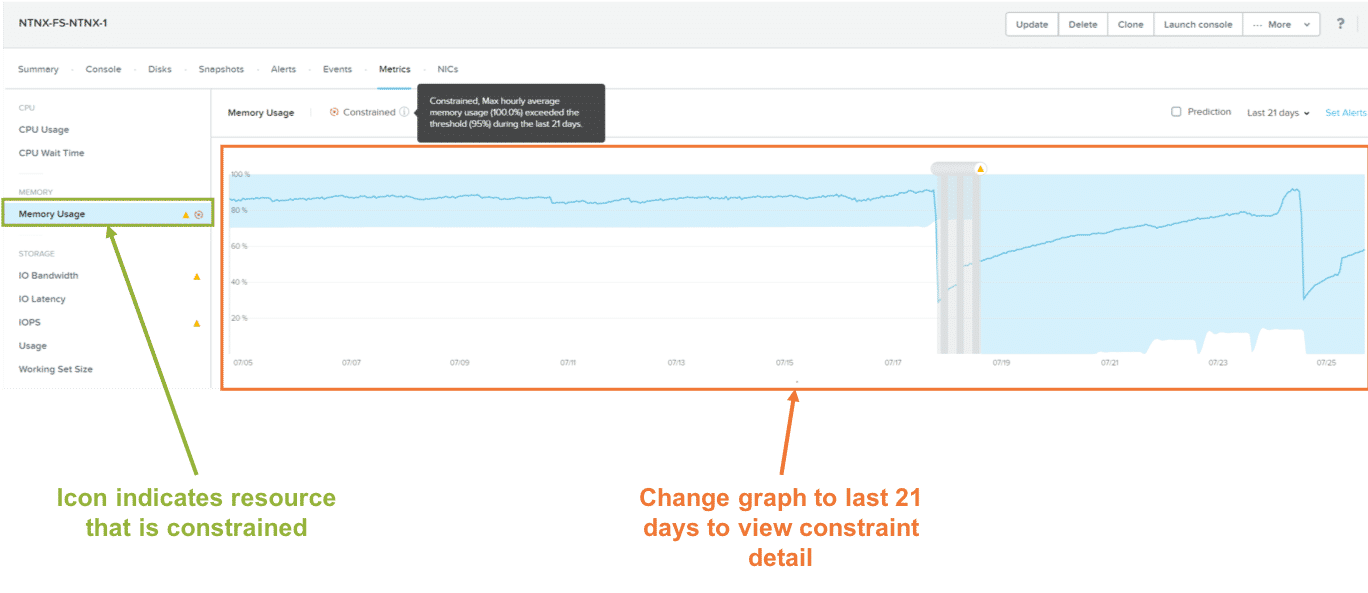
VM Right Sizing: Constrained VMs
- Constrained VMs are virtual machines which do not have enough resources to
function efficiently.
- You can help narrow performance bottlenecks and take corrective actions by resizing the VMs.
- Algorithm:
- Monitors Upper Band of Baseline Values for past
30 days to look for these factors:
- 2 Categories : Moderate/ High
- CPU Usage > 90/95%
- CPU Ready Time > 5/10%
- Memory Usage > 90/95%
- Memory Swap in/out Rate > 0 kbps
- 2 Categories : Moderate/ High
- Monitors Upper Band of Baseline Values for past
30 days to look for these factors:
VM Right Sizing: Over Provisioned VM
- An “over-provisioned” VM is the
opposite of a constrained VM.
- Over-provisioned VMs are too big for the job required, wasting resources.
- To prevent host resource wastage, resize (decrease) the overprovisioned VMs.
- A VM is considered over-provisioned when it
exhibits one or more of the following baseline values, based on the past 30
days:
- CPU usage < 20% and CPU ready time < 5%
- Memory usage < 50% (moderately) or < 20% (severely) and memory swap rate = 0 Kbps.
VM Right Sizing: Inactive VMs
- A VM on for more than 30 days and not utilized could be flagged as a zombie VM.
- A VDI VM could be flagged as a zombie
- Zombie VMs should be evaluated to see if they are valid and zombie vs dead and zombie.
| CPU Ready | CPU Usage | Memory Usage | |
| Bully | >5% | ||
| Constrained Moderate | >5% | >90% | >90% |
| Constrained High | >10% | >95% | >95% |
| Over Provisioned | <5% | <20% | <50% |